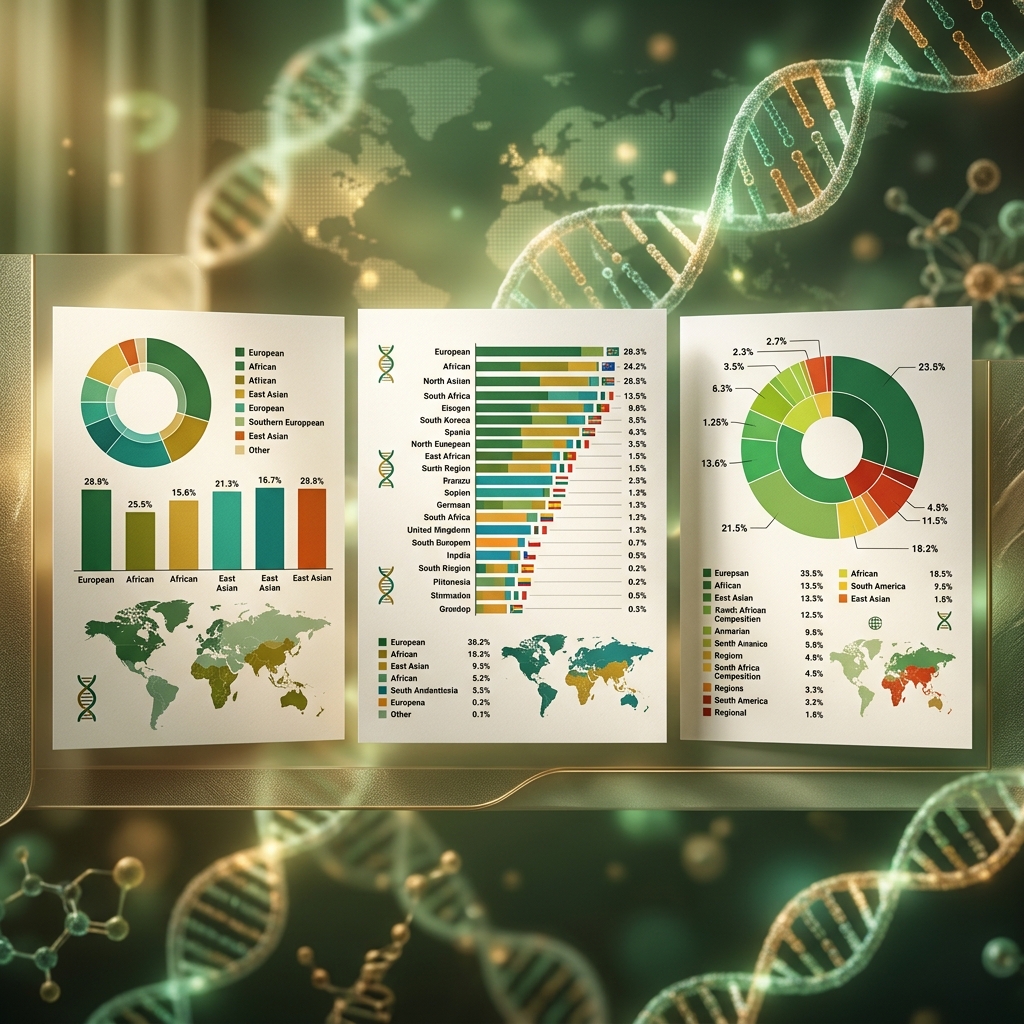
You take one DNA test and receive a result showing 42% Italian ancestry.
A second company reports 28% Italian, 19% Greek and Balkan, and 11% broadly Southern European.
Then the first company updates its analysis, and some of your percentages change again.
Your DNA did not change.
So why are the results different?
Ancestry percentages are estimates created by comparing sections of your DNA with reference groups used by each testing company. Different services use different databases, regional categories, algorithms, confidence thresholds, and update schedules.
That means two companies can analyze the same person's DNA and produce different—but not necessarily contradictory—interpretations.
Are Ancestry DNA Results Exact?
No ancestry percentage should be interpreted as an exact measurement of identity.
A DNA ancestry service does not directly read labels such as "Italian," "Irish," "Greek," or "Polish" from your genes.
Instead, the service generally:
- Examines sections of your DNA.
- Compares those sections with reference individuals.
- Calculates which reference populations provide the strongest statistical similarities.
- Assigns probable regions or population categories.
- Presents the result as an ancestry estimate.
The percentages describe the company's current interpretation of your genetic similarities. They are not a complete record of every ancestor, culture, nationality, or community connected to your family.
1. Every Company Uses Different Reference Populations
A reference population is a group of people whose DNA is used to represent a particular geographic or ancestral category.
Companies do not necessarily use the same people or the same regional definitions.
One service may have a large reference group for:
- Ireland;
- Southern Italy;
- the Balkans;
- Eastern Europe;
- specific Indigenous populations.
Another company may have fewer reference samples from those areas or divide the same geographic area differently.
For example, DNA associated with Southern Italy may also resemble reference samples connected to Greece, the Balkans, the Eastern Mediterranean, or the broader Southern European region.
One company may label the segment "Italian." Another may label it "Greek and Balkan." A third may use a broad category such as "Southern European." The companies may be seeing overlapping genetic patterns but describing them differently.
2. Regional Categories Are Not Standardized
There is no universal list of ancestry categories used by every DNA testing service.
One platform may separate England, Ireland, Scotland, and Wales. Another may group some of them into a broader British and Irish category.
Similarly, one company may separate Poland, Ukraine, Russia, and the Baltic region. Another may use broader Eastern European categories.
Because the category boundaries are different, the percentages can also look different. A broader regional result is not automatically less accurate. It may simply reflect the level of detail the company believes its data can currently support.
3. Neighboring Populations Often Share Genetic Similarities
Modern countries have political borders, but human populations have moved across those borders for centuries.
People migrated because of trade, marriage, war, work, religious change, shifting empires, forced displacement, education, and economic opportunities.
As a result, neighboring populations often share overlapping genetic patterns. It may be difficult to separate ancestry associated with France and Germany, Greece and the Balkans, Spain and Portugal, Poland and surrounding Eastern European regions, Scandinavia and Northern Europe, or the Eastern Mediterranean and Western Asia.
An ancestry algorithm must decide how to label DNA that could plausibly fit several related populations. Different companies may make different decisions.
4. Companies Use Different Algorithms
Even if two companies used similar reference data, their algorithms could interpret the DNA differently.
A company may differ in how it divides the genome into segments, calculates similarity, smooths neighboring DNA segments, handles uncertain matches, assigns broad or specific regions, removes statistical noise, and sets confidence thresholds.
One service may prefer a specific regional label when the probability is reasonably strong. Another may classify the same segment as broadly European or unassigned because its confidence requirement is higher. Neither decision necessarily means that the other company is completely wrong.
5. The Customer Databases Are Different
Each testing company has its own customers. This matters most for DNA matches, but it can also improve ancestry models over time.
If a company has many customers with deep documented roots in a particular region, it may be better able to identify genetic patterns connected to that population. Another service may perform better for a different country, migration community, or diaspora.
This is one reason users from underrepresented populations sometimes receive broader or less consistent results. The service may not yet have enough high-quality comparison data to make a more precise assignment.
6. Confidence Levels Can Change the Result
Some ancestry services use confidence thresholds to decide whether a DNA segment should be assigned to a particular region. At a lower confidence setting, a result may appear more detailed. At a higher confidence setting, some specific regions may become broader categories or disappear into "unassigned" ancestry.
For example:
Lower-confidence interpretation
- 18% Italian
- 9% Greek and Balkan
- 4% Sardinian
More conservative interpretation
- 25% Southern European
- 6% broadly European
The conservative result may appear less exciting, but it reflects greater uncertainty about the exact regional labels.
7. Ancestry Estimates Are Updated
DNA companies periodically update their reference populations, algorithms, geographic categories, country matches, confidence models, and historical migration groups.
After an update, your ancestry percentages may change even though you did not submit a new sample. This does not mean the original laboratory analysis failed. The company is interpreting the same genetic data using a newer model.
A region may increase, decrease, split into several regions, merge into a broader category, disappear, or return in a later update. Small percentages are usually more likely to change than large, consistent regional patterns.
Why Did One Country Disappear From My Results?
A country or region may disappear after an update because it was based on a low-confidence assignment, the segment was reassigned to a neighboring population, the company changed its category system, the reference group was updated, or the new model considers a broader label more appropriate.
Its disappearance does not necessarily prove that the earlier result had no meaning. It means that the company's current model no longer assigns that DNA to the same label with enough confidence.
Which DNA Company Is Most Accurate?
There is no single company that is automatically best for every person and every region.
Accuracy can depend on your ancestral background, the regions represented in the company's database, how closely your family matches the available reference populations, whether your ancestors came from highly mixed or border populations, the detail level of the report, and the company's latest algorithm.
A service may provide excellent results for one branch of your family and broader results for another. Instead of choosing a winner based only on percentages, compare the results with birth records, family trees, immigration documents, grandparents' birthplaces, surnames, DNA matches, and known family history.
Should You Average Results From Different Companies?
No. Do not calculate a simple mathematical average of ethnicity percentages from different services. The categories are not necessarily equivalent.
For example, "Eastern Europe" from one company may cover a different area than "Eastern European and Russian" from another. "Greek and Balkan" may overlap partly with "Southern Italian."
Instead, look for recurring regional patterns. If several services repeatedly identify Southern European ancestry, the broad pattern may be more meaningful than the exact percentage assigned to Italy or Greece.
What Should You Trust Most?
Strongest for documented family history
- birth certificates;
- marriage records;
- church registers;
- census records;
- immigration files;
- verified family trees.
Strongest for biological connections
- close DNA matches;
- tested parents;
- tested siblings;
- shared-match clusters;
- documented descendants of common ancestors.
Useful for regional exploration
- recurring ancestry regions;
- country matches;
- genetic groups;
- migration communities;
- visual ancestry tools.
Not proof by themselves
- facial resemblance;
- surnames alone;
- family legends;
- one small ethnicity percentage;
- an AI photo result.
The most reliable ancestry story usually combines several types of evidence.
DNA Ancestry vs. Ancestor Lens
DNA ancestry services analyze genetic material. Ancestor Lens analyzes visible patterns in a photograph and creates a visual heritage experience.
| Feature | DNA ancestry test | Ancestor Lens |
|---|---|---|
| Input | Saliva or cheek swab | Photograph |
| Result | Genetic ancestry estimate | Visual regional resemblance |
| Processing time | Often several weeks | Usually instant |
| DNA required | Yes | No |
| Finds DNA relatives | Potentially | No |
| Proves ethnicity | No | No |
| Main purpose | Genetic exploration | Visual discovery and entertainment |
A DNA service asks: Which reference populations does my DNA resemble?
Ancestor Lens asks: Which regional and historical patterns does my appearance visually resemble?
Neither result defines your complete identity.
What to Do When Your Results Disagree
- Download or save each result.
- Note the date and algorithm version when available.
- Separate broad regions from specific countries.
- Identify patterns repeated by several services.
- Compare the results with known grandparents and great-grandparents.
- Examine DNA matches connected to each region.
- Build a documented family tree.
- Research historical borders and migration.
- Treat very small percentages cautiously.
- Recheck the results after major updates.
Explore which countries your facial features visually resemble — no DNA kit required.
Frequently Asked Questions
Why do AncestryDNA and 23andMe show different results?
They use different reference populations, algorithms, confidence thresholds, databases, and geographic categories.
Did my DNA change when my ancestry estimate changed?
No. The interpretation changed, not your DNA.
Which ethnicity percentage should I believe?
Focus on consistent broad patterns and compare them with family records and close DNA matches rather than treating one percentage as absolute truth.
Why does one company show a country that another company does not?
The companies may group neighboring populations differently or have different levels of reference data for that region.
Are small DNA percentages accurate?
Small percentages can represent a real signal, statistical uncertainty, or overlap between neighboring populations. They are generally more likely to change after updates.
Can siblings receive different ancestry percentages?
Yes. Siblings inherit different combinations of DNA from their parents, unless they are identical twins.
Can a photo ancestry app confirm my DNA result?
No. A photo-based app can explore visual resemblance but cannot confirm genetic ancestry.
Final Thoughts
Different ancestry results do not mean that your DNA is changing. They show that ancestry estimation is an evolving process of statistical comparison.
One company may describe a segment as Italian. Another may see a broader Southern European connection. A third may divide it between several neighboring regions.
Look beyond the exact percentages. The strongest story appears where DNA matches, family records, migration history, repeated regional patterns, and family memories begin to support one another.
Recommended Articles
- 👉 How Accurate Are Ancestry DNA Tests?
- 👉 What Do Ancestry DNA Percentages Really Mean?
- 👉 Where Does My Last Name Come From? Find Your Surname Origin
- 👉 How to Find Your Ancestors' Immigration Records Online
- 👉 How to Understand DNA Matches: A Beginner's Guide
- 👉 How to Build a Family Tree From Scratch
- 👉 AI Ancestry Test vs DNA Test: Key Differences Explained
Explore the Story Behind Your Face
Ready to see which countries your facial features may visually resemble? Try Ancestor Lens — no DNA kit required.